
Select an option to the left to see samples of output
Our statistical consulting provides support, education, and comprehensive details. Please click on the links to the left to see abbreviated examples of our work. Does your statistician/consultant do this?
How We Explain Statistical Results
Following is a small example of output from a between groups design involving sex differences on a measure of anxiety. The output presents the results of a t-test for independent samples. This is our general approach:
“The following analysis represents an independent samples t-test for your data. An independent samples t-test is an appropriate statistical method because you have a single dependent variable (Anxiety) which is continuous and a single independent variable with two categories (Sex). The t-test is used to see if the difference between groups was statistically significant.
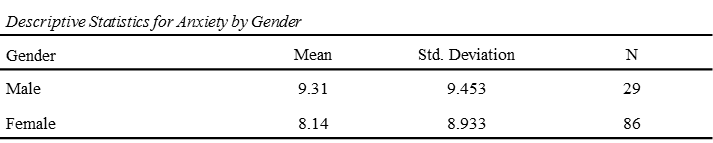
Following are descriptive statistics for males and females on anxiety. A majority of this sample was female. Note that the mean for males was higher than the mean for females.
You may recall that one of the assumptions of a t-test is equal
variances (homogeneity of variance). In the context of your
research, it means that the spread of scores (variability) on
anxiety was similar for males and females. A Levene’s test can be
used to test this assumption. Be advised that a non-significant
Levene’s test suggests that the equal variances assumption was not
violated.
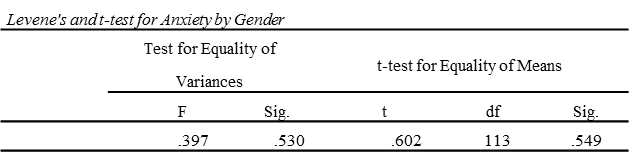
The following table shows a Levene's test and a t-test test of the difference between group means. Since the Levene’s test was nonsignificant (sig. value of .530), this is evidence that the assumption of equal variances was not violated. Note that the t-test corresponding to the difference between males and females on anxiety was not statistically significant (sig. value of .549).
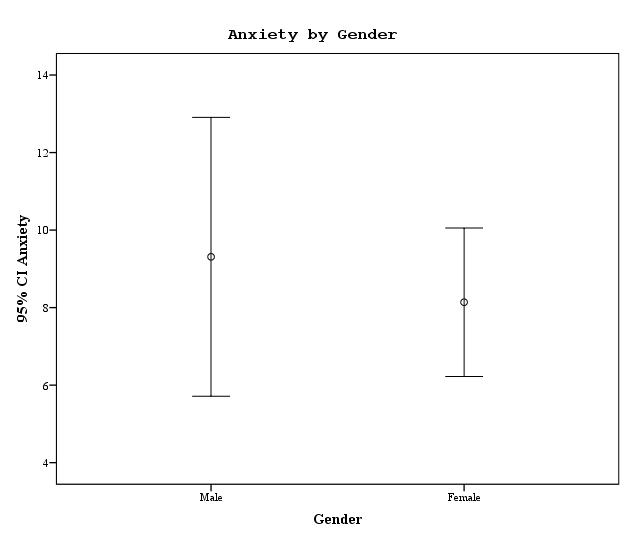
Optionally, we might use a high resolution graph to examine these
means. Following is an example of an "error-bar" graph. The
horizontal axis shows the male and female groups. The vertical axis
shows a range of possible scores on the dependent variable anxiety.
The circles on the graph represent the mean for each group. The
perpendicular brackets above and below represent the 95% confidence
interval around the mean. Note that the confidence intervals for the
males and females overlap, which is consistent with the
nonsignificant t-test reported above.
Summary: The hypothesis that there would be significant gender differences on anxiety was not supported by this data. Although the mean for men was higher than the mean for women, the difference was not large enough to be statistically significant."
Examples of Our Data Analysis Recommendations
We prefer to be involved during the design stage of any study because we can help you to anticipate and avoid problems. Here is an abridged example of one type of research design recommendation:
"Following are some common methodological reasons for the rejection of research proposals:
• The scope of the project is so large that
the researcher will likely never finish. For example, the researcher
with a very limited budget wants to study 'everyone in the United
States…'
In the context of your research, we are concerned that you may not have the resources to gather enough data. Further, you do not appear to have a plan for obtaining a scientific sample. Following are some specific recommendations….”.
Here is a separate example:
"Power is the probability of making the correct decision resulting from a statistical test (power is a good thing). Since it is a probability, power ranges from zero to one. Zero means that the researcher will never make the correct decision, while power of 1 indicates that the correct decision will be made every time. As you might imagine, the power of a statistical test is often somewhere in between. Importantly, we can estimate the sample size required to achieve various power levels. Following are the results from a power analysis that applies to your research...
The data analysis plan is very important when designing a research proposal.
Examples of Instructions for Organizing Data
The organization of data is far more important that many researchers realize. Here is a sample of some of instructions we might provide to a client.
"Attached to this email is a file that you can use to enter data. Let us know if you have any difficulty opening this file. Each row in the data file corresponds to an individual respondent and each column represents a different variable. There should be a unique respondent identification number for each participant. Note that the first row contains variable names in letters.
Following are the variables that were included in your data
file.
id
IDENTIFICATION NUMBER. Enter a unique identification number for each
subject. This number is arbitrary and is used to signify a given
individual.
Gender
Enter 0 = Male, 1=Female"
and so on...
Examples of "Teaching" Research and Statistical Methods
We provide many instances of general research design advice.
"Be sure to find out which format is required for your results section.
APA is a common format. Some
general guidelines are: each table gets a unique number, each table has a
title in italics, use no vertical rules (lines) in the body, the columns in
the table should be evenly spaced out, always align the information in the
columns, double space within the table, and use the same number of decimal
places within the table. "
and/or
"Use the following guide to decide if a given statistic was significant or if it was due to chance. The “Sig” column within the output represents the probability that the observed statistic was due to chance. An observed statistic was “significant” when the value of “Sig” was less than the probability of making a false positive conclusion (known as ‘alpha’ or the probability of type 1 error). A common cutoff for alpha (the probability of type 1 error) is .05. If the value of “Sig” is greater than alpha (commonly .05), the corresponding statistic may have arisen due to chance. Be advised that the ‘Sig’ value in the output is also known as a “p” value."
and/or
"Following is some important background information about categorical data analysis. The ‘odds’ of an event is the ratio of the probability that an event will occur to the probability that it will not. Most people use the term ‘odds’ to refer to ‘probability’ but ‘odds’ has the specific meaning indicated above. For purposes of interpreting this research, do not confuse the two. Following is a hypothetical example of how to calculate the odds."
We are statisticians who do far more than present pages of numbers. Does your statistician/consultant do this?